
Compass Investors
Performance Graph
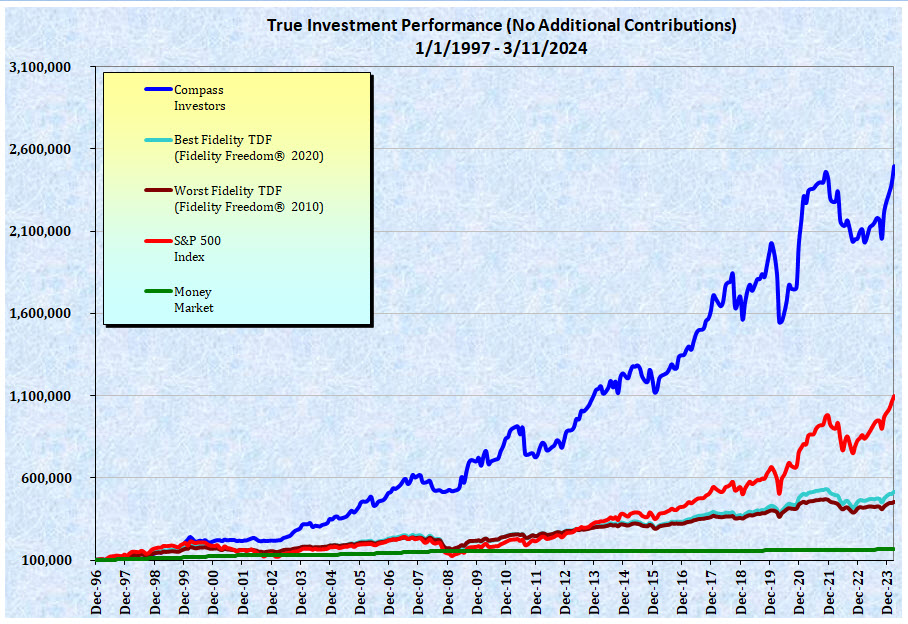
Compare the performance of HORIZONTM side-by-side
with other strategies since 1997.

Compare the performance of HORIZONTM side-by-side
with other strategies since 1997.
Money Market. The most "conservative" investment risk strategy.
BEST and WORST Fidelity Target Date Funds (TDF).
The best and worst Fidelity TDF chosen with 20/20 hindsight as proxies for a
formulaic asset allocation (FAA) investment approach. A TDF is a blended stock and bond mutual fund classified as "moderate" or "balanced" investment risk. Fidelity's funds are chosen as they one of the largest providers of TDF and have offered these products since 1997.
S&P500 (Dividends Reinvested). Wall Street's best indicator, representing an "aggressive" investment risk strategy.
HORIZONTM Adaptive Asset AllocationTM*. The back-tested blended performance of all supported plans.
Click to see how HORIZONTM performed for YOUR fund collection.
* Our objective process and calculation of results were independently reviewed by Ashland Partners and Company, LLP in 2006. The HORIZONTM computer model has remained unchanged and the results for the period shown are simulated. Actual performance may be higher or lower. Please contact us for a full copy of the Ashland report.


