![]()
HORIZON™ for Fidelity Choice Series S1
Plan Performance
Your Current 5-Year Benchmark Period Results
As of April 15, 2024, the HORIZON™ Model Portfolio
for the Fidelity Choice Series S1 Plan (FIDB) has seen a
59.1% pure investment return
(excludes plan growth due to contributions)
over the past
63-months since the most recent
rolling five-year benchmark performance period started on January 1, 2019.
Compass Investors urges subscribers not to focus on short-term results--whether
up or down--as you should instead focus on the superior results that HORIZON™ provides over the long-term (see Market Cycle results that follow). HORIZON™ is the ONLY strategy that you can count on to produce increased gains in sustained up
markets and protection of account value in severe down markets thereby always keeping you
on the path towards having Retirement Income Security.
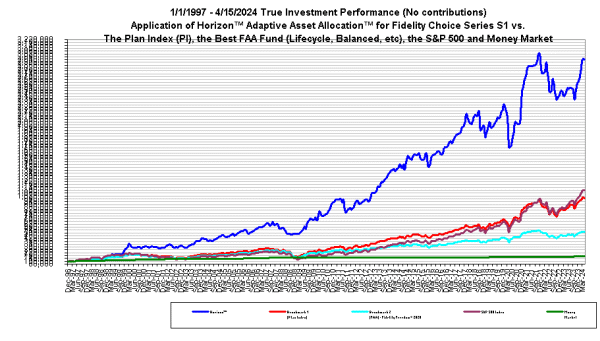
During the Market Cycle that began 01/01/1997, as of 04/15/24, an initial $100,000 starting investment guided by HORIZON™’s Adaptive Asset Allocation™ (AAA) strategy grew by $2,836,705 to $2,936,705, a growth of 2,837% (excluding any additional contributions). Please refer to the Service Disclaimer for additional information on the calculation of performance and the use of proxy and benchmark funds in the HORIZON™ Model Portfolio.
This compares to the growth, over that same period, of $100,000 invested in the following alternatives:
- The Plan Index (PI)* grew by $890,057 -- HORIZON™’s growth was 219% higher.
- The best performing Formulaic Asset Allocation (FAA)** fund (Fidelity Freedom® 2020) grew by $410,936 -- HORIZON™’s growth was 590% higher.
- The S&P 500 Index with dividends grew by $1,000,244 -- HORIZON™’s growth was 184% higher.
- A Money Market investment grew by $70,940 -- HORIZON™’s growth was 3899% higher.
IMPORTANT NOTE ABOUT PERFORMANCE. Performance information presented in charts and tables represent back-tested performance of the HORIZON™ strategy applied to the funds included in the HORIZON™ Model Portfolio. Back-tested performance is hypothetical (it does not reflect trading in actual accounts), assumes that fund trades and exchanges are made at the closing price of a fund on both the stated starting and ending date of the reporting period, does not adjust for fund holding or repurchase period restrictions, and is provided for informational purposes only. Please refer to the Service Disclaimer for additional information on the calculation of performance and the use of proxy and benchmark funds in the HORIZON™ Model Portfolio.
Legend
HORIZON™ Starting Year Results
Click on your HORIZON™ enrollment year to view your plan's benchmark results:
The path to Retirement Income Security requires a commitment to a long-term view. Saving for retirement is a marathon, not a sprint. Horizon™'s unique approach of identifying best positioned funds based on the current market conditions, combined with on-going periodic adjustments assures stability and conservation of portfolio value during down markets and acceleration of growth during up markets. Horizon™ significantly outperforms the best of the most commonly used and advocated investment strategies during all market periods.
![]()